September 2, 2026
RaftViz: visualizing Raft for the classroom
Consensus is the part of my Distributed Systems course where students’ eyes glaze over. Not because the idea is hard — a group of processes agreeing on one thing — but because the mechanism is relentless: terms, votes, log freshness checks, quorums, commit indices. Pseudocode on a slide tells you what happens; it doesn’t let you watch it happen.
So I built something that does both at once. I recently published RaftViz, an interactive, step-by-step visualization of the Raft consensus algorithm, in which every animated event is wired to the exact line of lecture-notes pseudocode that produced it. Students can step through a leader election one line at a time, then crash the leader themselves and watch the cluster heal.
The twist: I wrote none of the code. Roughly 6,000 lines of JavaScript, all of it produced by AI coding agents under fairly tight direction. Read on for the pedagogical idea, a tour of what it does, an unexpected bug it found in the lecture notes it was built from — and what I learned about steering coding agents on a project where correctness actually matters.
Teaching consensus
At KU Leuven I teach a Distributed Systems course in the Master in Computer Science programme. It’s a broad entry-level course that covers the basics: message-passing abstractions and RPC, vector clocks, broadcast algorithms, distributed transactions, file systems, and — at the far end — consensus.
We use Maarten van Steen’s excellent Distributed Systems textbook, but for several lectures I lean heavily on Martin Kleppmann’s Concurrent and Distributed Systems lecture notes, developed for a similar course at Cambridge. They are unusually good: rigorous, compact, and — crucially for what follows — they lay out complete, readable pseudocode rather than hand-waving at the hard parts.
Consensus algorithms are notoriously hard to understand
Exhibit A is Paxos. Leslie Lamport’s The Part-Time Parliament (1998) is now a classic, but it was famously so hard to absorb that Lamport himself followed up with Paxos Made Simple (2001), whose abstract consists of a single deadpan sentence: “The Paxos algorithm, when presented in plain English, is very simple.” That did not settle the matter. An entire subgenre of papers followed, each attempting the explanation its predecessors had failed at: Paxos Made Live (Google engineers, on what it actually takes to build the thing), Paxos Made Practical, Paxos Made Moderately Complex. When a distributed algorithm needs four sequels just to be understood, something has gone wrong with the exposition — and, arguably, with the algorithm.
That frustration is precisely what motivated Diego Ongaro and John Ousterhout to design an alternative. Their 2014 paper In Search of an Understandable Consensus Algorithm is unusual in treating understandability as a primary design goal, on a par with correctness and performance. They even ran a user study, teaching Raft and Paxos to students and measuring which one they could actually reason about afterwards. Raft won.
Raft is genuinely elegant: a cluster of nodes reliably replicates a log of commands, with a single elected leader driving replication and stepping aside when it fails. But elegant is not the same as simple. Getting the job done safely — under crashes, partitions, and message reordering — still takes a lot of mechanism, and that mechanism is what students have to internalize.
The material I was already using
Kleppmann’s notes cover Raft across nine slides of pseudocode, laying out the whole algorithm so students get to appreciate the real complexity of solving consensus under realistic assumptions.
Alongside those slides I show Ben Johnson’s wonderful Secret Lives of Data visualization. It is a browser-based scripted animation (built with d3.js) that does a tremendous job of building intuition for leader election: you see the election timers drain, the vote requests fly, the leader emerge.
The two halves worked well, but they never quite met in the middle. The animation builds intuition without ever showing you the algorithm; the pseudocode shows you the algorithm without ever moving. Students would nod along to the animation, then stare at slide 6 as if it were a different subject entirely. The translation step between “the picture I remember” and “the code on the slide” was left entirely to them — and that translation is the hard part.
The idea: RaftViz
So: what if the animation and the pseudocode were the same artifact? What if every message dot flying across the screen highlighted the exact line that sent it, and every variable on the slide had a live value next to the node that owns it?
That’s RaftViz. This is what it looks like:
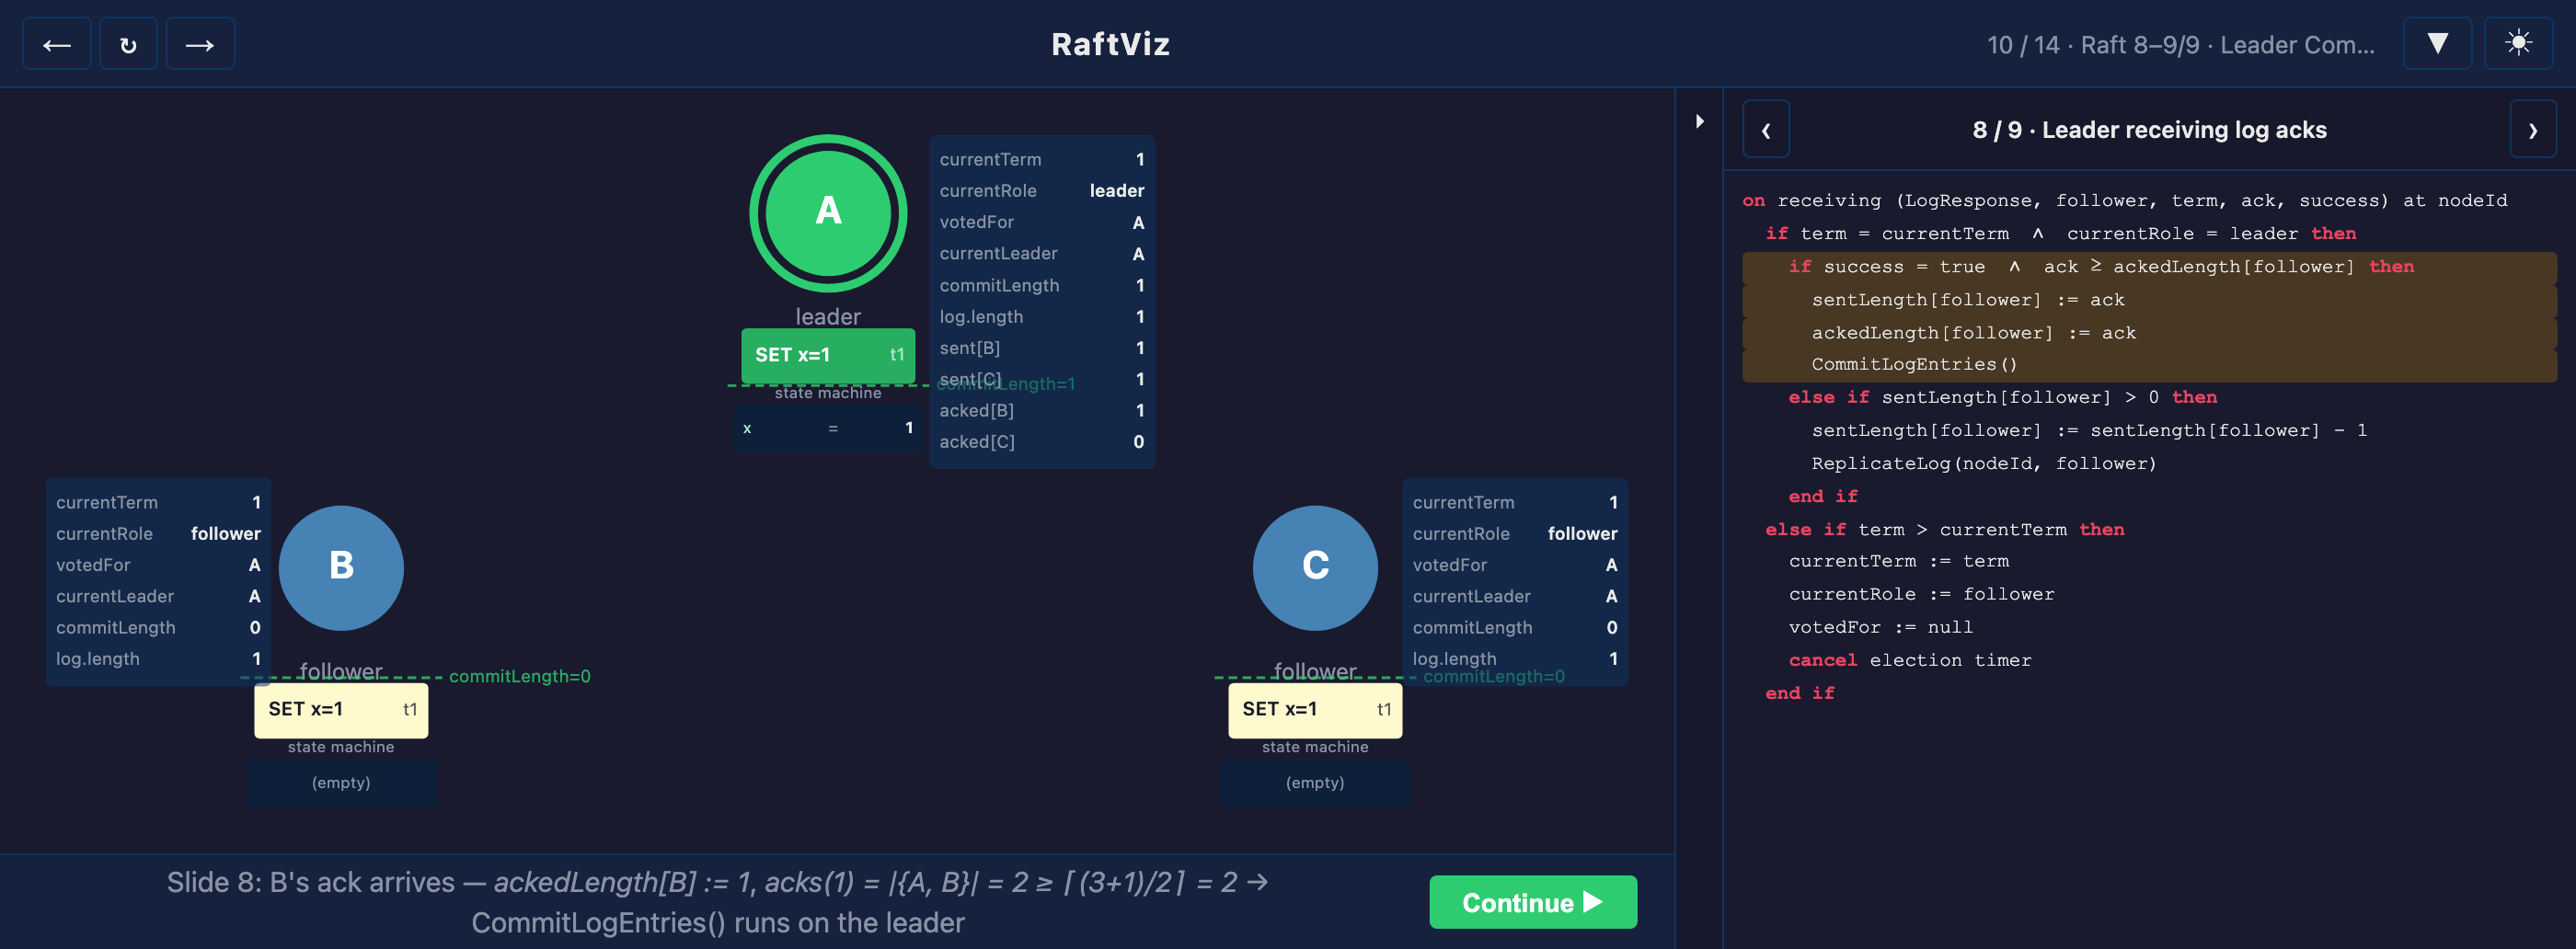
To the left you see a cluster of three nodes (processes), each with its live Raft variables, log, and state machine output. To the right you see Kleppmann’s pseudocode (taken verbatim from his lecture slides), with currently executing lines highlighted. The text at the bottom tells the student what’s going on.
Here’s a full run — three nodes cold-start, hold an election, and replicate and commit three client commands, with the pseudocode panel tracking along (recorded at 2× speed for demo purposes only):
In addition to letting the algorithm run its course (as shown above), RaftViz comes with pre-scripted scenes that animate the algorithm one step at a time and then pauses, so there’s time to read what happened before moving on.
All scenes are driven by the real algorithm: the scripted animations call a set of functions that are a line-by-line transliteration of Kleppmann’s pseudocode into executable JavaScript. Nothing on screen is faked for effect, so what students see is what the algorithm does.
A bonus: it found a bug in the lecture notes
Here’s the thing about turning pseudocode into something executable: it starts answering back.
While playing around with RaftViz, I found a specific scenario that kept misbehaving. With two surviving nodes, a follower would grant its vote to a candidate and then, a moment later, time out and start its own higher-term election — deposing the very node it had just helped elect. The cluster thrashed instead of settling - a kind of bug also known as a “livelock”.
The pseudocode was implemented faithfully; the pseudocode was the problem. In the
real Raft paper (§5.2), a node resets its election timer whenever it grants a
vote, not only when it hears from a leader — precisely so the candidate it just
voted for gets a full timeout’s worth of time to collect a quorum and start
sending heartbeats. Kleppmann’s slide 2 sends the positive VoteResponse but
never resets the timer. It’s a latent liveness gap: harmless in most executions,
clearly visible in a three-node cluster with one node down.
So the implementation diverges from the slide by one line — and rather than hide that, the panel makes it explicit with a comment rendered in the pseudocode:
send (VoteResponse, nodeId, currentTerm, true) to node cId
reset election timer  // (not on Kleppmann slide)
It’s a humble reminder that pseudocode, while pedagogically useful, is no substitute for an exectable, testable implementation.
Beyond the original: role transitions, a sandbox, and a quiz
Three things go beyond what Johnson’s visualization of Raft already does.
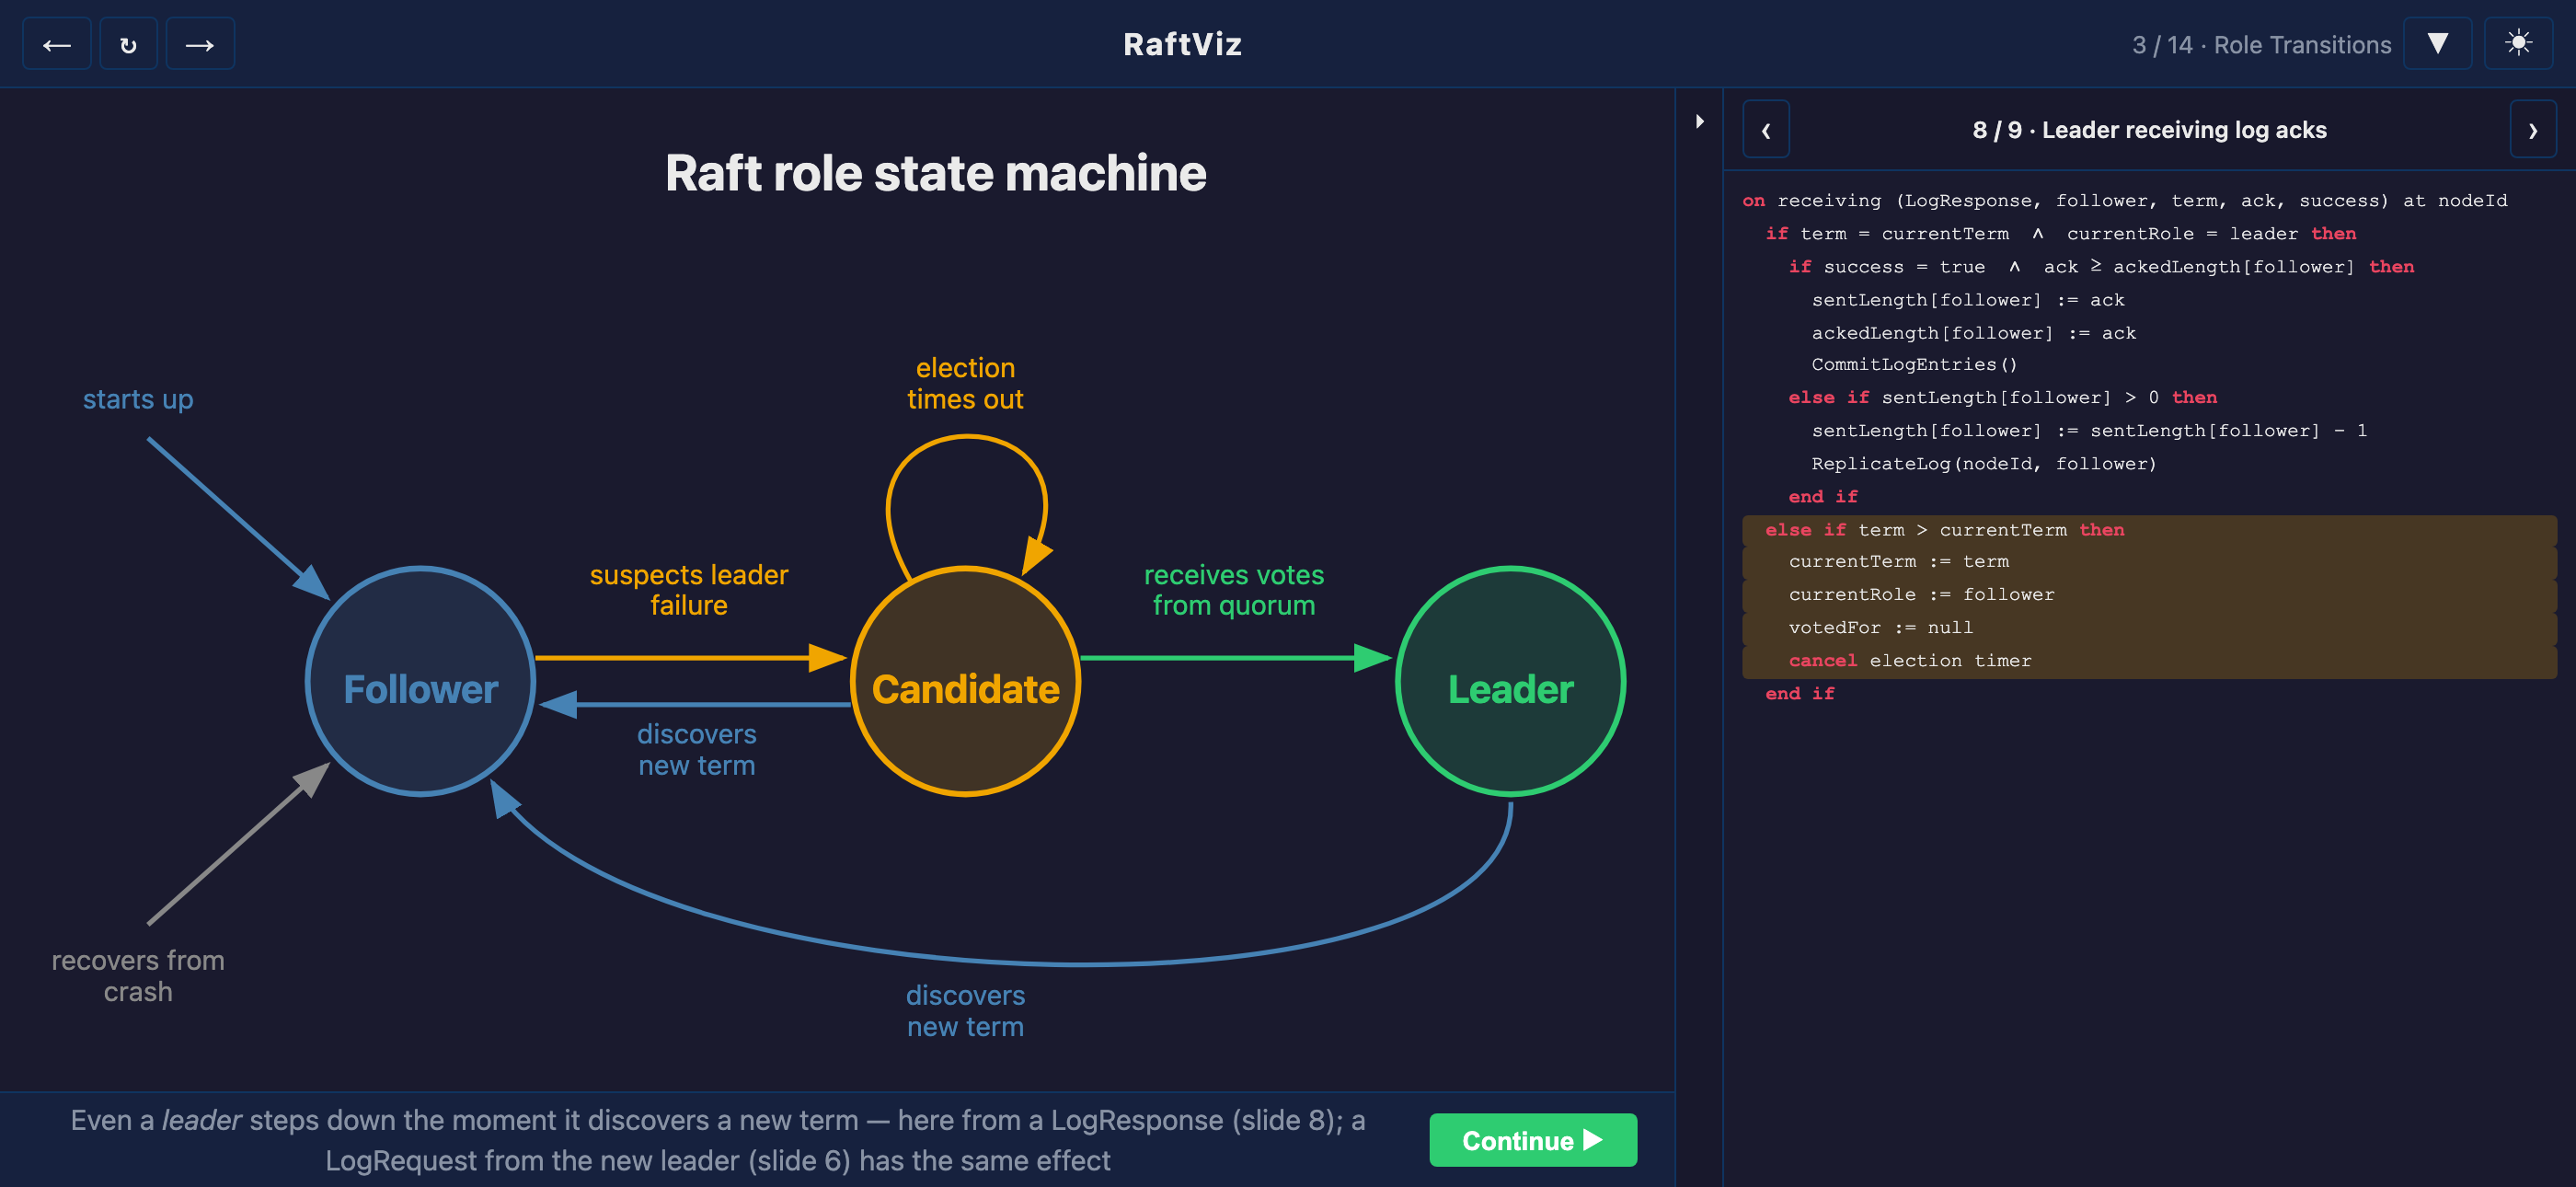
A state-machine scene. In Raft, nodes can take on one of three roles during the lifetime of the algorithm, and understanding this upfront gives the students a useful mental map of what is going on. Before diving into the details, RaftViz shows Raft’s follower / candidate / leader state machine — with each arrow highlighting the pseudocode where the state transition takes place.
A free-play sandbox. After going through a series of carefully scripted scenes, Scene 13 finally hands the cluster over to the student: they can click any node to crash it (click again to recover), drag between two nodes to cause a network parition, and inject new client commands into the cluster.
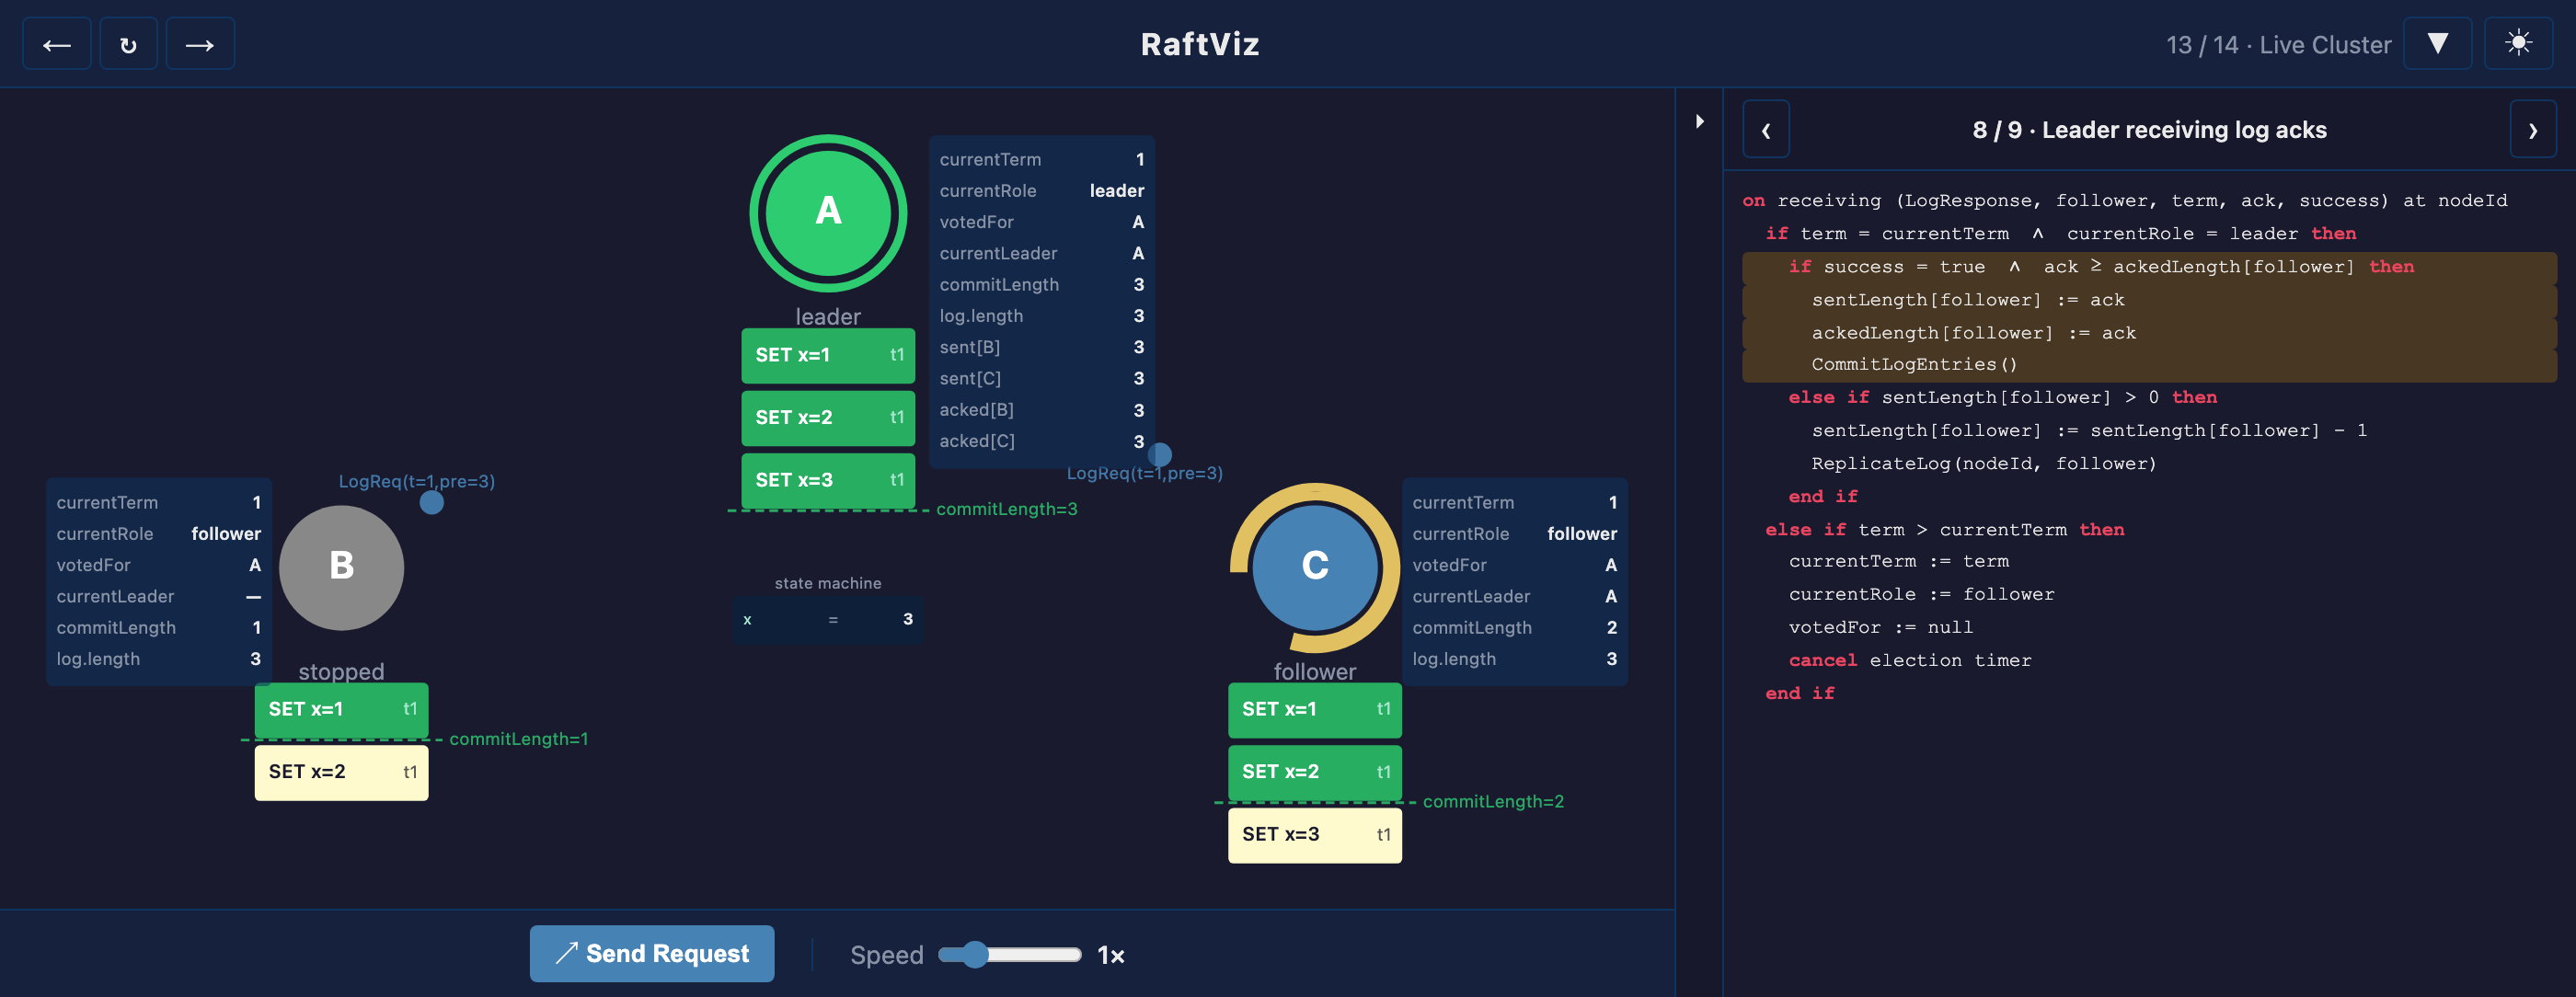
Node B is crashed (grey). Note what survives: its log, currentTerm and
commitLength are stable storage; its volatile state is gone. Node C’s election
timer is visibly draining.
The guided tour provides a list of scenarios worth working through, in increasing order of insight. Two of my favourites:
- Isolate the leader. Partition it from both followers. It can no longer reach a quorum, so it stops committing — while the other two elect a new leader among themselves. You now have a visible split-brain scenario: the old leader still believes it’s in charge and is making no progress whatsoever. Heal the partition and watch it discover a newer term and step down.
- Break the quorum. Crash two of three nodes. The survivor can’t reach a quorum, so no election succeeds and nothing commits. The cluster is unavailable but not incorrect — the CAP trade-off, made concrete in about fifteen seconds.
A capstone quiz. The last scene checks whether the intuition actually stuck, in the style of Will Crichton’s interactive fork of the Rust Book. Six multiple-choice questions, no feedback until the end, then a per-question review with the correct answer and an explanation that points back at the exact pseudocode line.
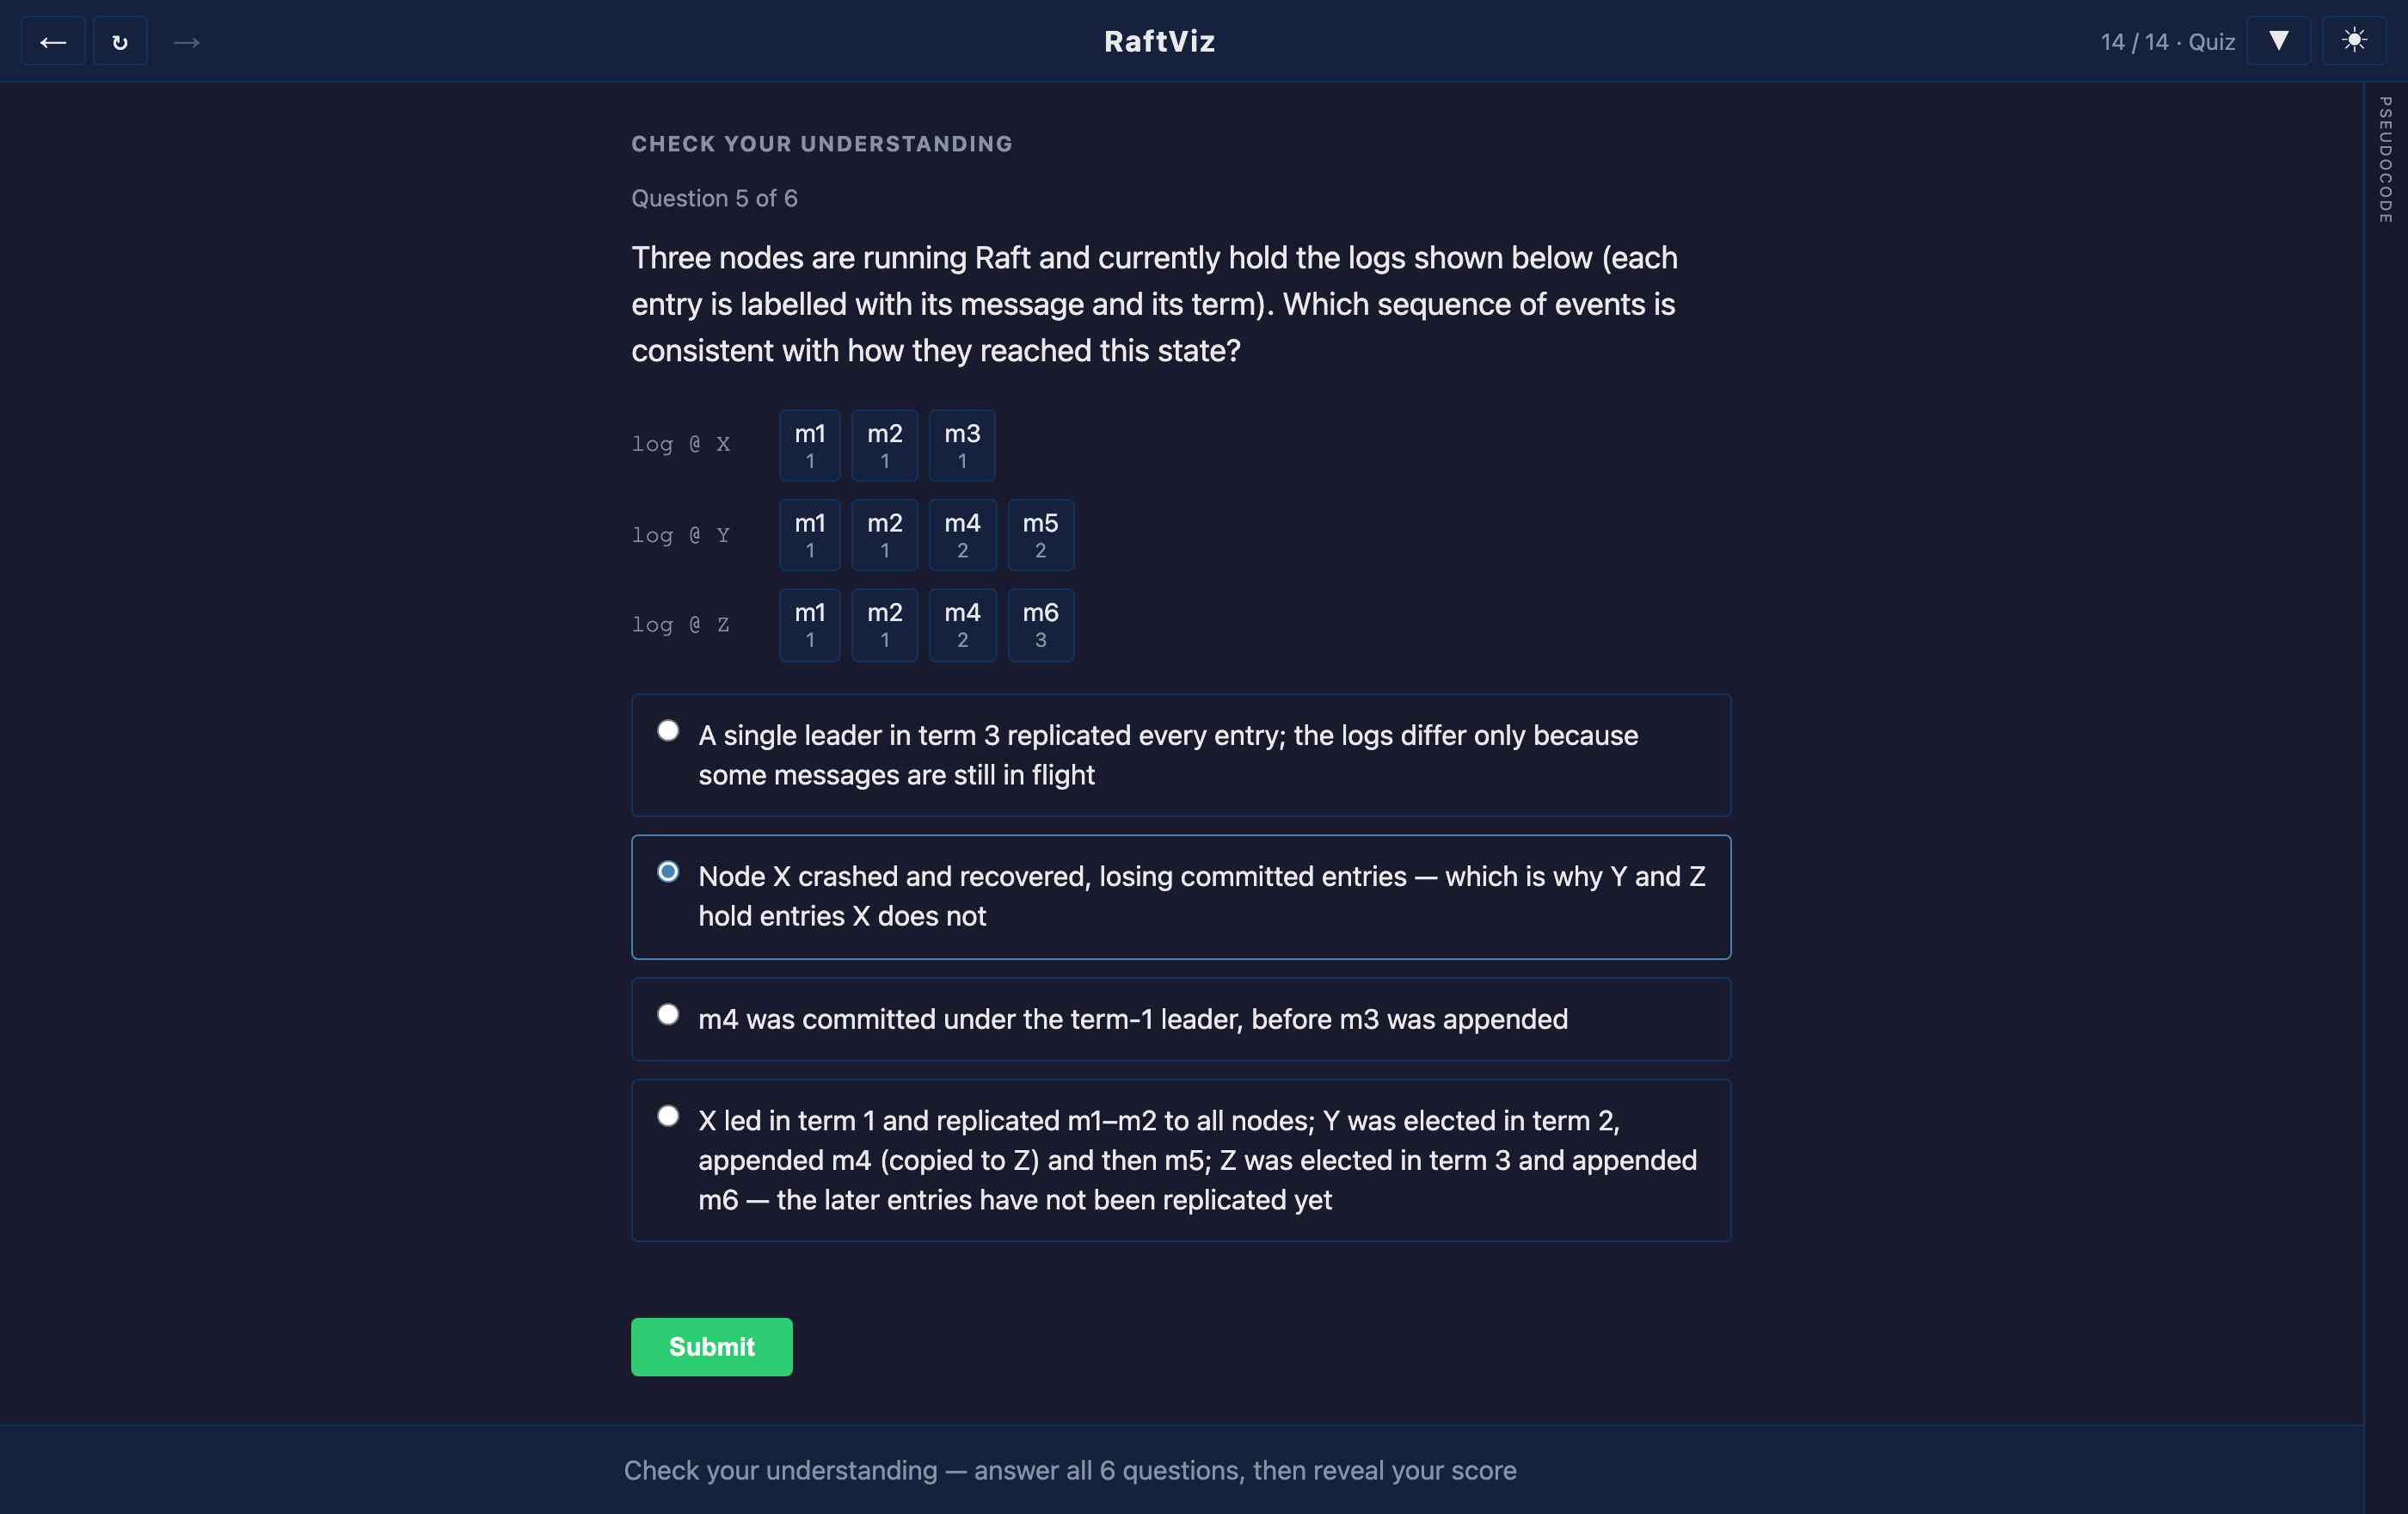
The last two questions share this snapshot of three divergent logs — students have
to reconstruct a sequence of leaders and terms that could have produced it, then
work out what each node’s commitLength can legally be. It’s a great way
for the students to test their own understanding.
Under the hood
RaftViz is a 100% JavaScript/HTML/CSS static site, and it requires no bundler, no npm
install, no network dependencies. d3.js is pre-bundled as a single file. Serve the
directory with python3 -m http.server and it runs. For a teaching artifact this
simplicity removes all of the friction to go from source code to an executable that
can run anywhere.
The architecture keeps a hard line between a simulation core (~950 lines of pure logic, no DOM: nodes, messages, and a discrete-event scheduler handling latency, crashes, and partitions) and a layout layer that renders whatever state the core is in. That separation is what makes the core unit-testable — and it allows the scripted scenes and the free-play sandbox to share the same algorithm implementation.
How I built this with AI coding agents
Now the reveal I flagged at the top: I did not write the hundreds of lines of tedious animation code. I wrote zero lines of code myself.
This codebase was “agentic engineered” (as in “not vibe coded”) with a variety of language models and coding harnesses, with Claude Opus 4.x doing most of the heavy lifting. I picked the project partly as an excuse to work with the current generation of coding harnesses: most of it was done with GitHub Copilot and Claude Code, a small part with Cursor.
The method was spec-driven: iterate on a SPEC.md until it pinned down the
architecture, the pseudocode-to-code mapping, and the scene list; then generate a
staged PLAN.md of phased to-do items; then work the phases. Development artifacts
like SPEC.md, PLAN.md and CLAUDE.md are deliberately kept out of the public
repo — the students get the tool, not the scaffolding.
Some things I’d do again:
- Get tests in early. Unit tests for the pseudocode-to-JavaScript translation
came in during phase one and paid for themselves immediately. Agents run tests,
read the failures, and extend the suite when you ask them to — but only if the
suite exists. That’s 33 tests over the nine handlers, covering the parts that are
easy to get subtly wrong: the
logOkfreshness checks, theAppendEntriestruncation arithmetic, the current-term commit rule. - Turn the agent’s own verification checks into permanent tests. At some point I noticed Claude driving a headless browser to check its work visually. I had it promote that throwaway checking into a real Playwright smoke test that steps through all the visualization scenes and inspects the rendered output. Now every change is verified end-to-end, not just at the unit level.
- Context is key. I pointed the agents at the LaTeX source of Kleppmann’s lecture material and gave explicit instructions not to deviate from it — especially on naming. I also handed over the source of Johnson’s visualization and asked the agents to study how it was built before writing anything, so the visual language would build on prior art instead of being reinvented worse.
- Be careful with time. Coding agents eat d3 for breakfast. They are extremely good at SVG visualization work — genuinely better than I would be. With one exception: they have no feel for human-scale timing. How long an animation should linger, when to pause for reading, how much beat to leave between two related events — that’s where I intervened most. It’s a good illustration of where the boundary currently sits: the agent knows what d3 can do; it doesn’t know what a tired student at the back of a lecture hall can follow.
- Ask for a code-quality pass explicitly. Mid-project I requested a deliberate review-and-refactor round. It produced exactly the kind of tidying you’d want from a careful colleague: named constants replacing duplicated literals, dead code removed, stale comments fixed. Agents won’t volunteer this — the code already works — but they’re very good at it on request.
- Ask for a critical review of the pedagogy, too. I asked what would make the tool teach better, and kept several of the suggestions. The most valuable one: the playground never highlighted the leader-side receive handlers, so two of the nine slides simply never lit up during free play. That’s the kind of coverage gap that’s invisible when you’re the one who wrote the scenes.
- Let the agents generate the documentation media. Knowing the agents could take
screenshots through Playwright led to a neat trick: every
screenshot and clip in the README, the guided tour — and this blog post — is
generated, not hand-captured. A
tools/capture.jsscript drives the same headless Chromium the smoke test uses, scripting each scene to the exact frame worth capturing, and ffmpeg transcodes the recordings. When the visualization changes, the documentation can be kept in-sync with a simple script, which is not a sentence I’ve been able to write about any previous project of mine.
It is worth being clear about the shape of the effort: it did not feel like less work than writing the code myself, but it was different work — specifying, reviewing, and judging rather than typing and fussing over details. And it produced something I would otherwise never have built, because the tedium-to-payoff ratio of hand-writing hundreds of lines of animation choreography for one lecture is just not favourable. That’s the real unlock: not that agents write code faster, but that they change which projects are worth starting.
Lessons for the classroom
The broader lesson I’m taking from this is about what these tools do to teaching material, specifically.
Every lecturer has a folder of static assets: slides, notes, pseudocode, diagrams that have been faithfully redrawn every year since some ancestor made them in PowerPoint. They’re static not because motion wouldn’t help — of course it would — but because the cost of making them interactive has always been prohibitive for a single lecturer with a single course. You do not spend three weeks building a custom visualization for one lecture in one module.
That calculus has shifted. The dull, high-volume, high-precision work — the animation choreography, the state management, the accessibility polish, the documentation screenshots — is exactly what coding agents are now good at. What remains for me is the part that was always mine: knowing which idea is the hard one, where students actually get lost, and how long to hold a frame before moving on. Which is, I’d argue, a rather good division of labour.
So my slides on Raft are no longer slides. They’re something students can step through at their own pace, deep-link into, break on purpose, and then be quizzed on. Same material, same pseudocode, same lecture — but now it moves, and now they can poke it.
Let the material come alive. Let students play.
RaftViz is on GitHub at tvcutsem/raftviz and live at tvcutsem.github.io/raftviz. Code is MIT-licensed; the pseudocode content is CC BY-SA 4.0, following its source. There’s a guided tour covering every scene, the sandbox controls, and the colour language. If you teach consensus, please take it and adapt it — and tell me what breaks.